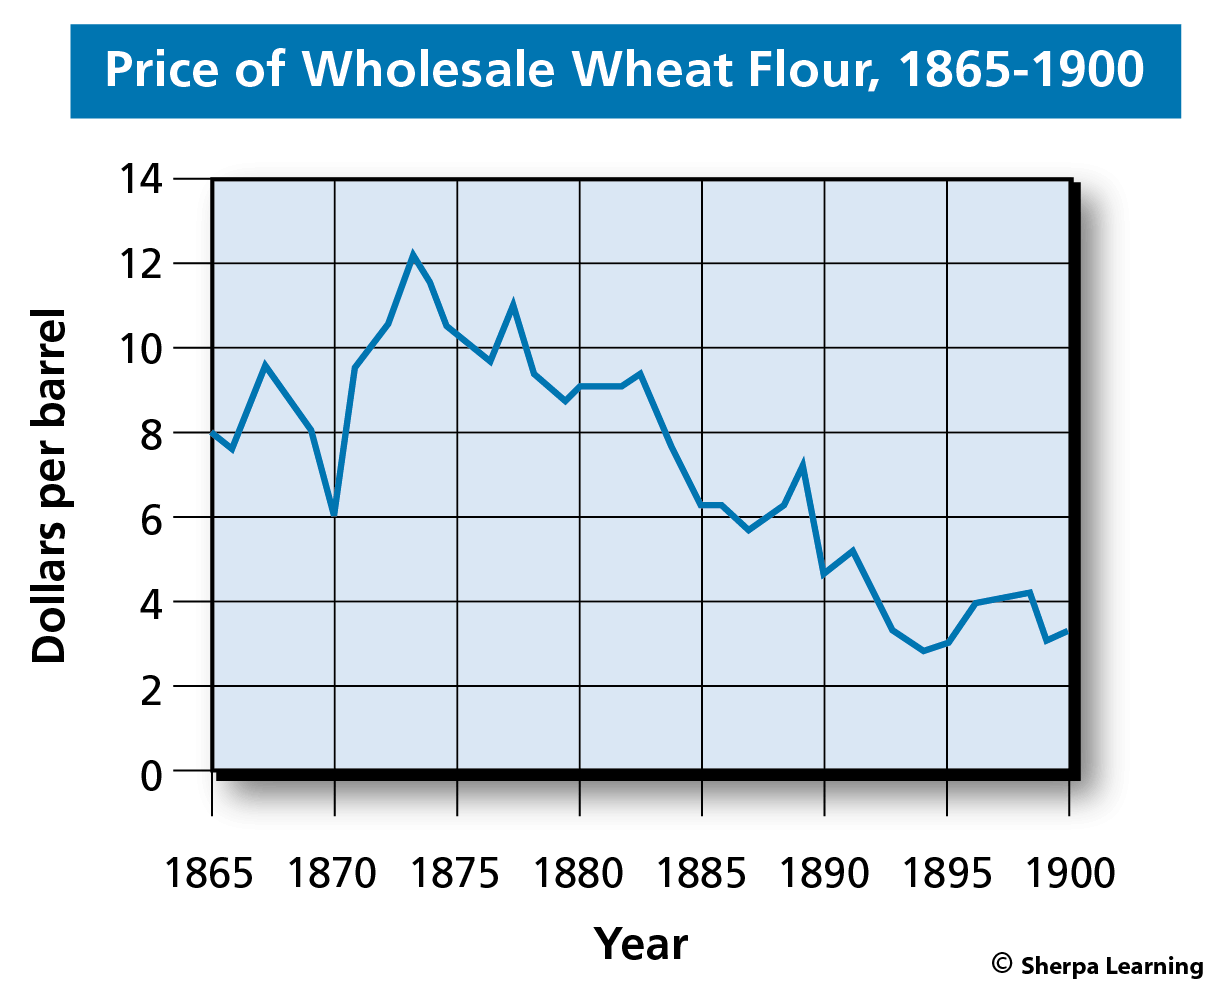
Exercise #9 - Graph: Price of Wholesale Wheat Flour, 1865-1900
U.S. History Skillbook
Exercise #9
Price of Wholesale Wheat Flour, 1865-1900
Analyze the graph below, and then answer the questions that follow. Refer to Chapter 12 (page 47) for guidance on effective graph analysis.

What trends do you see in the graph? Who would benefit from these trends? Who would be hurt? What were the causes of the trends?
